


Data From Your Doorstep to Help Map Pollution
NEW DELHI: If you have a low-cost air quality monitor at home, you can now be part of a large pollution study to understand its dynamics in the capital.
Participants can place the monitor outside their house and send data regularly to a team of scientists at the Evidence for Policy Design. The team is based at Harvard Kennedy School and hosted in India by the Institute for Financial Management and Research.
EPoD India, Energy Policy Institute at the University of Chicago, Open Networks and Big Data Lab at New York University are developing a “fine-grained real-time air quality monitoring network” to make what they call “pollution heat maps”. They have just started piloting it in Delhi with a network of 10 monitors spread across Safdarjung Enclave, Green Park, Hauz Khas Village, Hauz Khas, Yusuf Sarai and Uday Park in south Delhi, but plan to extend it across the city connecting as many low-cost monitors as possible.
The capital currently has the highest number of real-time monitoring stations in the country run by the central and Delhi governments — Delhi Pollution Control Committee alone has 26 stations, Central Pollution Control Board has six and he Indian Meteorological Department has eight stations. Low-cost monitors are priced anywhere between Rs 12,000 and Rs 30,000, whereas government-run monitors cost more than Rs 1 crore.
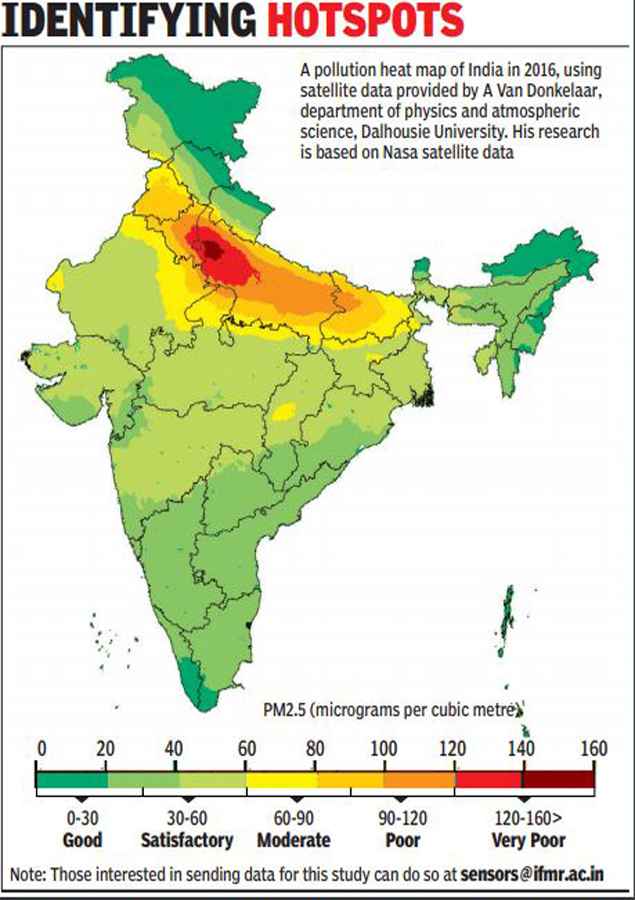
What is interesting, however, is the idea of having this dense network is not only to gauge how high air pollution levels are, but to map variations in air quality across the city, identifying pollution hotspots, determining sources, testing policies being implemented by the governments. The data from the air quality monitors will be fed into a statistical model to better understand spatial variation. The data will be analysed from a socio-economic perspective as well to see distributional impacts of air pollution on various income brackets.
The team also aims to assess the effect of air pollution on learning, development and physical health on schoolchildren, study whether shutting the school or cancelling classes is an effective policy or there is need for defensive measures, such as using masks. Overall, the team will study if air pollution information increases civic action or encourages people to take preventive measures.
Initial readings at the 10 locations being monitored by the EPoD India team show there are differences in PM2.5 (fine, respirable pollution particles) even between neighbourhoods. The daily trends show significant peaks during early morning and evening hours. Researchers at EPoD India said the finer the grid of monitors, the better it will be for understanding nuances.
“The whole idea of developing this heat map is to see how you can make data actionable,” said Giudy Rusconi, research manager, EPoD.
This article first appeared in The Times of India.